
Engineering intelligence that closes tickets itself
Tickets that close themselves —
engineering intelligence for GitHub & GitLab teams.
Deviera detects 32 kinds of engineering friction and takes 24 automated actions — opens tickets, nudges reviewers, tracks DORA, and auto-resolves the moment the issue clears.
No credit card required • See your first signal in about 30 minutes
What teams see in the first 30 days
Across more than a hundred automations running in production:
saved per week
Less firefighting, more shipping
faster incident response
Proactive detection vs. reactive
average setup time
GitHub + Linear + Jira + ClickUp + Slack
Built for teams using
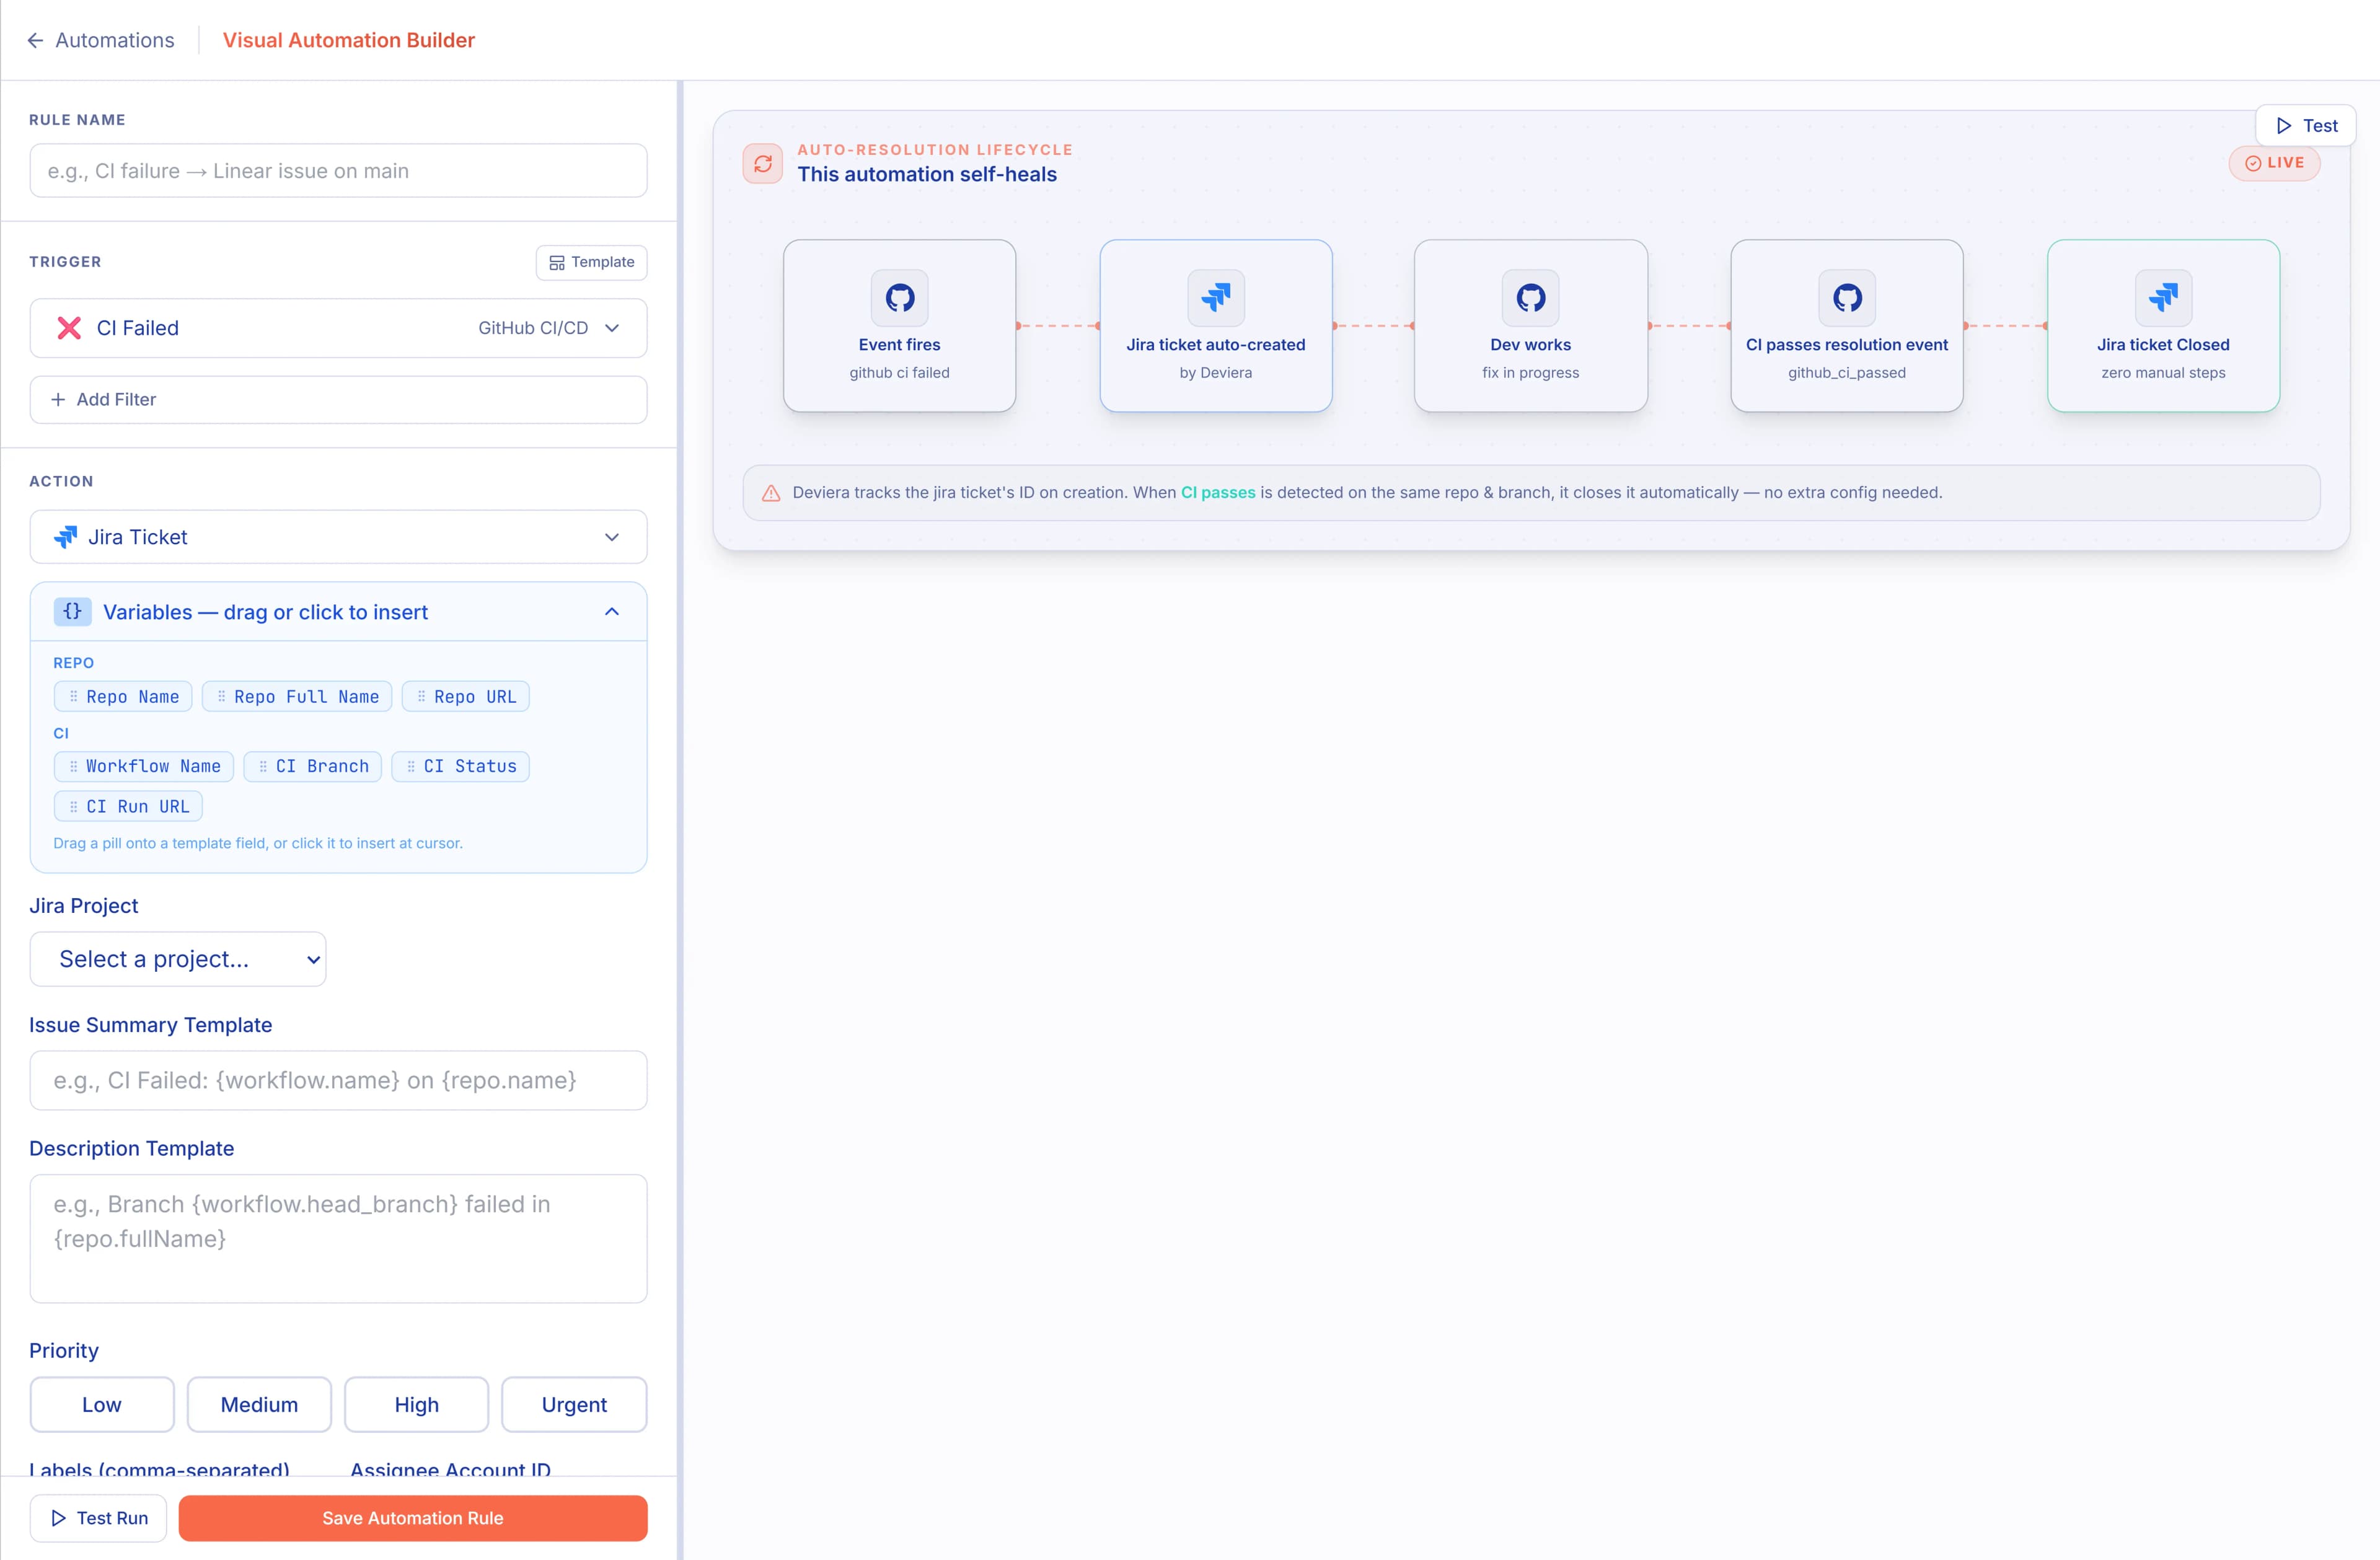
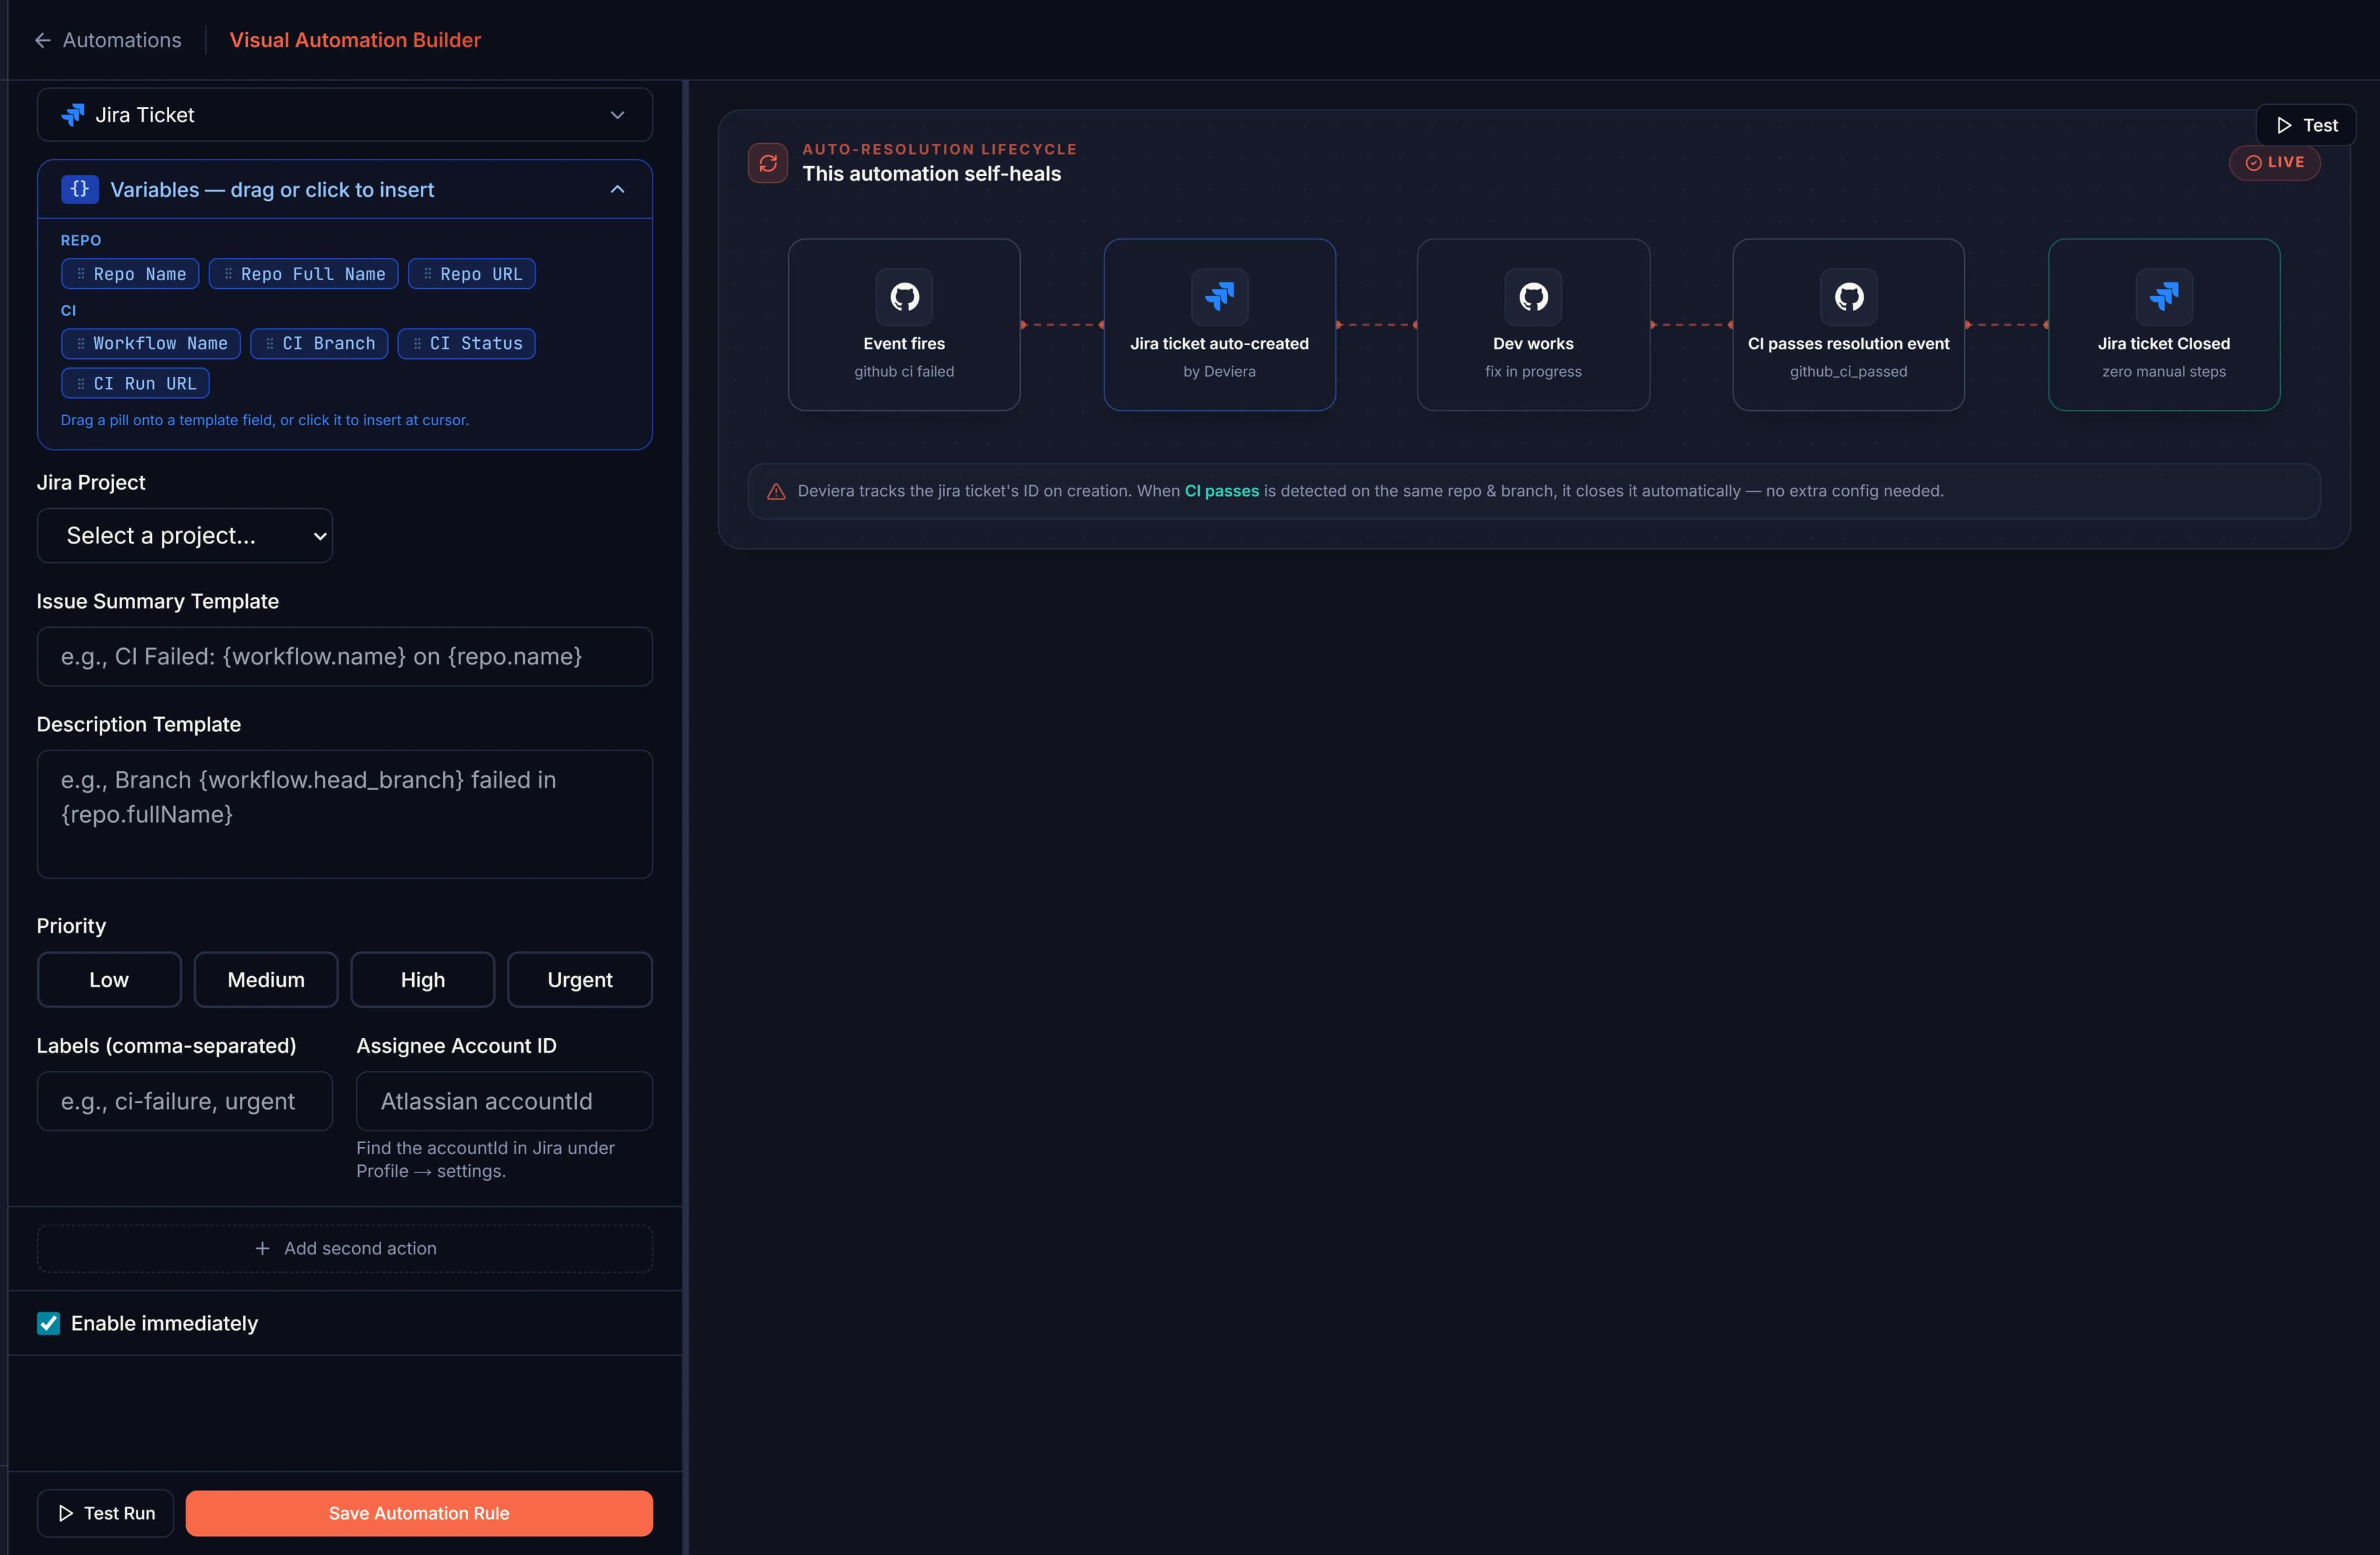
Build automations without writing a single line of YAML
Pick a trigger, add the conditions that matter to your team, and choose an action — create a Linear issue, post to Slack, open a Jira ticket. Auto-resolution closes the ticket the moment the underlying problem clears, so your backlog stays honest.
107 automation templates — pick one and ship
Pre-built workflows for engineering teams using GitHub, GitLab, Vercel, Jira, Linear, Slack, and ClickUp
Template Library
pre-built automations
Auto-create flaky test issue
Triages repeat failures into your issue backlog
Escalate blocked merge requests
Flags review bottlenecks in real time
Post failed deployment digest
Summarizes incidents for fast response
Sync CI failures to incident queue
Adds structured context automatically
Detect. Structure. Route. Resolve. Automatically.
CI failure detected → issue created → routed to team → fix committed → issue auto-closed. Zero manual steps.
CI failure detected
DETECT
Linear/Jira/ClickUp issue
STRUCTURE
Assign to team workflow
ROUTE
Fix committed by dev
FIX
Issue auto-resolved
RESOLVE
See exactly what Deviera does
Not hypotheticals. Real signals, detected and resolved automatically — while your team stays focused on shipping.
CI fails on main
PR sits 3 days without review
A flaky test starts failing intermittently
A deployment fails on Vercel
Not alerts. Actions.
Every other tool notifies you. Deviera unifies your GitHub, GitLab, Linear, Jira, ClickUp, Slack, and Vercel signals — and acts on them automatically. Tickets created. Issues resolved. Hours returned.
Automatic Detection
Pattern-based detection catches CI failures, flaky tests, stale PRs, and deployment issues. No manual rules to write.
- ✓ Detects failure streaks
- ✓ Identifies flaky patterns
- ✓ Threshold tuning (not just alerts)
Linear, Jira, ClickUp & Auto-Resolution
Creates structured issues in Linear, Jira, or ClickUp with root cause context. Automatically resolves when the problem is fixed.
- ✓ Linear + Jira + ClickUp + GitLab issues
- ✓ Auto-close on resolution
- ✓ Smart prioritization
ROI Measurement
Quantify time saved. See ROI accumulate over time with charts, trends, and actionable metrics.
- ✓ Minutes saved per automation
- ✓ Historical trends
- ✓ Budget justification
Cross-Provider Deduplication
Per-automation cooldowns + 3-day cross-provider title dedup. No spam. No duplicate issues across Linear, Jira, ClickUp, or GitLab.
- ✓ Title-based matching
- ✓ Cross-provider dedup
- ✓ Zero noise policy
Real-Time Signal Feed
Live dashboard showing every detected signal with severity badges, issue links, Slack notifications, and minutes saved.
- ✓ See friction instantly
- ✓ Severity scoring
- ✓ Workspace visibility
GitHub & GitLab at Scale
GitHub App install for your org + GitLab OAuth for groups. All repos monitored from a single dashboard.
- ✓ GitHub App + GitLab OAuth
- ✓ Scales to 1000+ repos
- ✓ Unified signal feed
DORA Metrics & Delivery Intelligence
Live DORA Metrics, PR Cycle Time, Health Score, Investment Distribution, and PR Bottleneck Radar — all computed automatically from your GitHub events and benchmarked against 2025 State of DevOps tiers.
- ✓ Deployment Frequency, Lead Time, CFR, MTTR
- ✓ Median + P75 PR Cycle Time per repo
- ✓ Composite Health Score trended over time
- ✓ PR Bottleneck Radar — live stalled & reviewer-less PRs
AI Code Impact Tracking
Track how Copilot, Claude Code, Cursor, and Cody are affecting your team's velocity. Per-repo breakdown, adoption trends, and correlation with commit frequency.
- ✓ Multi-tool AI adoption tracking
- ✓ Velocity correlation
- ✓ Per-repo breakdown
Built for the team doing the work
Engineering managers who need visibility. DevOps engineers tired of firefighting. CTOs who need to justify tooling spend. Deviera delivers for all of them.
DevOps Engineers
"Our CI is flaky but nobody has time to investigate"
With Deviera:
- ✓ Automatic flaky test detection
- ✓ Multi-repo health dashboard (GitHub + GitLab)
- ✓ CI intelligence + stability scoring
Engineering Managers
"I don't have visibility into what's blocking my team"
With Deviera:
- ✓ Real-time signal wall
- ✓ Bottleneck visibility
- ✓ One signal feed across GitHub, Jira, Linear & Slack
- ✓ PR Cycle Time + Health Score per repo
- ✓ Team Flow — review wait time + WIP breach tracking
VP Engineering / CTO
"How do we justify tooling spend to the CFO?"
With Deviera:
- ✓ Quantify productivity gains
- ✓ ROI in minutes saved
- ✓ Budget justification data
- ✓ DORA Metrics benchmarked against State of DevOps
- ✓ Investment Distribution by category
- ✓ AI adoption impact
Platform / DevOps Teams
"We need to monitor 100+ repos but can't hire more people"
With Deviera:
- ✓ GitHub App + GitLab OAuth
- ✓ Multi-repo health dashboard
- ✓ 8 integrations, one pipeline
How It Works
From detection to resolution in 6 steps — the loop closes itself, across every provider you connect.
Install GitHub App
Org-level access. One setup. All repos monitored.
Connect Your Stack
Linear, Jira, ClickUp, GitLab, Slack — OAuth. Pick your team. Done.
Enable Templates
107 pre-built templates. Or build your own.
Watch for Friction
Deviera monitors CI, PRs, and deployments — detecting patterns and tracking DORA metrics as it goes.
Create Issues
Structured Linear / Jira / ClickUp / GitLab issues. With context. Instantly.
Auto-Resolve
When fixed, Deviera closes issues across all providers. You measure ROI.
Visual Automation Builder — pick a trigger, add conditions, set a Linear action. No YAML.
Average time to first detected signal:
Under 30 minutes
Install → Connect → Enable → See friction
DORA metrics, tracked automatically
Deployment Frequency, Lead Time, Change Failure Rate, and MTTR — computed from your GitHub and Vercel events and benchmarked against the 2025 State of DevOps. No instrumentation. See the metrics guide →
Value Dashboard — DORA tier, 30-day trend, and the hours saved behind it.
Live Signal Feed — every friction event as it happens, with severity, repo, branch, and Linear issue links.
The 6 Engineering Friction Patterns We Detect
Every pattern is automatically surfaced, routed to Linear, Jira, ClickUp, or GitLab, and resolved — without manual triage.
Silent CI Failures
CI broke 45 minutes ago. Nobody noticed. Your on-call missed the Slack ping.
Deviera detects the failure, opens a Linear/Jira/ClickUp task with the workflow name and branch, and auto-closes when CI goes green.
Flaky Test Blindness
Tests alternate pass/fail. Engineers assume it's environmental. The bug ships.
Deviera identifies alternating pass/fail patterns and flags flaky workflows before they mask real failures.
PR Review Bottlenecks
PRs sit unreviewed for days. Velocity drops. Merge conflicts pile up silently.
The stale PR scanner runs every 6 hours and creates issues (or Slack alerts) for PRs that have been waiting too long.
FIXME Debt Accumulation
FIXME, TODO, and HACK comments pile up in every commit. No one creates the ticket.
Deviera scans every commit for FIXME/TODO/HACK/XXX patterns and creates a structured issue in Linear, Jira, or ClickUp per finding.
Deployment Failures Untracked
Vercel says the deployment failed. Slack was the only notification. The ticket never got created.
Vercel deployment events flow into Deviera. Every failure becomes a prioritized issue with the project name and environment.
Issue Triage Lag
GitHub issues sit unlabeled for a week. Critical bugs get triaged after the customer complains.
Bug-labeled issues instantly create high-priority tickets in Linear, Jira, or ClickUp, so nothing falls through the cracks.
Why Teams Add Deviera to Their Stack
GitHub Actions handles CI. Vercel tracks deployments. Slack delivers notifications. Manual processes don't scale. Deviera does what none of them do alone — detect patterns across your whole stack, route structured tickets to Linear, Jira, or ClickUp, and close the loop automatically.
| Aspect | Deviera | GitHub Actions | Slack Bots | Manual |
|---|---|---|---|---|
| Setup Time | 5 min (GUI) | 30+ min (YAML) | 10 min | N/A |
| Detection Type | Pattern-based | Event-based | Keyword matching | Human |
| Issue Trackers | Linear + Jira + ClickUp + GitLab | No | Webhook hack | No |
| Deduplication | 3-day cross-provider | Manual | Ad-hoc | None |
| ROI Visibility | Real-time dashboard | Workflow logs | Slack messages | Unmeasured |
| Team Collaboration | Team+ feature | Per-repo | Org-wide | Manual |
Know Your Team's Engineering Health
The Friction Score gives you one number to represent your team's current engineering friction level — updated in real time as signals arrive.
Friction Score · Last 7 days
Lower is better · 0 = no friction, 100 = critical
/screenshots/TODO-linear-issue.webp
Frequently Asked Questions
Everything you need to know. Can't find what you're looking for? Ask us directly.
Your pipeline broke 40 minutes ago. Does Jira know?
Connect GitHub in 5 minutes. Deviera detects friction, routes it as a structured ticket, and closes it when the problem clears — automatically.
No credit card required • 14-day Pro trial • Free tier: 5 automations • See your first signal in about 30 minutes
Built with enterprise-grade technology